Heatmap
Heatmaps are great for looking at lot of data that deal with intensity or density.
About
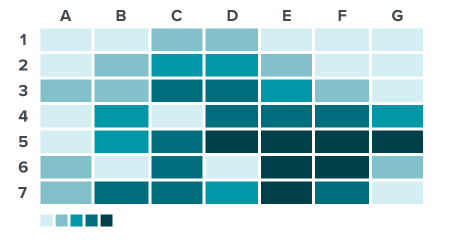
Heatmaps are great for looking at lot of data that deal with intensity or density. These are usually colored in sequential or diverging color scales. They can be used instead of tables or scatter plots.
Sample
TBD
Dos & Don'ts
Do
Do use a sequential or dividing color palette
Don't
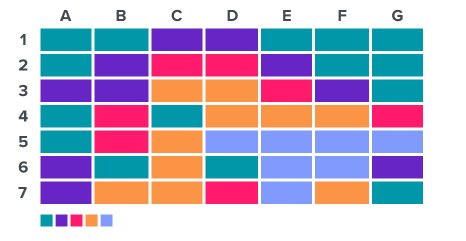
Don’t use too many colors