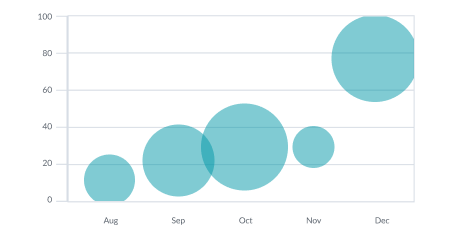
Bubble Charts
These are very similar to a scatterplot, the difference is that the size of the bubble varies based a third variable.
About
A Bubble Plot uses circles to represent values for two different numbers on the horizontal and vertical axis. These are very similar to a scatterplot, the difference is that the size of the bubble varies based a third variable. These can be used to see data, see patterns, or to see outliers.
Sample
TBD
Dos & Don'ts
Do
Do use circles and base the size on area not the radius
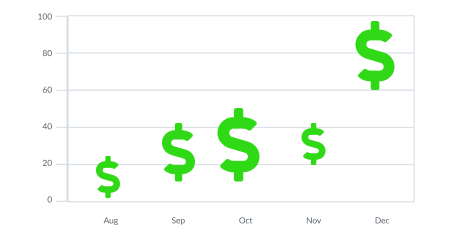
Don't
Don’t use odd shapes